


Oil traders. Illustrative. Via Wikimedia Commons.
What's Happening in the Oil Markets?[1]
A year ago OPEC and a group of non-OPEC countries, the most important of which was Russia, agreed on a 1.8 million barrel a day (mb/d) cut in oil production. In November 2017, this deal was extended until the end of 2018. The main reasons for the deal were the rise in US crude output that has reached 9.7 mb/d for the first time since 1970, and slower growth of Chinese demand. If OPEC and the non-OPEC states maintain their output quotas as planned, then they may well achieve their stated aim of significantly reducing OECD oil stocks from the high levels that currently prevail. This would help to maintain prices. OPEC pledged to cut 1.2mb/d (just under four percent of their output) and non-OPEC producers 558,000 barrel a day (b/d), with Russia cutting production by 300,000 b/d. OPEC members decided to take action as the fall in oil prices since mid-2014 has led to a sharp decline in revenues, cuts in investment and massive layoffs in oil-producing countries. This situation has affected government budgets and economic growth. It was significant that the agreement was reached given the tensions within OPEC: Iran and Saudi Arabia have been fighting a proxy war in Yemen and are in conflict over Syria and Lebanon. The aim of stabilizing prices was, however, in the interest of all OPEC members and in the interest of other producers, notably Russia. Table 1 shows how Middle East oil production has declined in the last year while Table 2 shows the inverse relationship between US oil stocks and prices.

Source: World Bank Group.
Global Economic Prospects, June 2017 : A Fragile Recovery.
Washington, DC: 2017, pg.92.
Available under CC BY 3.0 IGO.

Source: World Bank Group.
Global Economic Prospects, June 2017 : A Fragile Recovery.
Washington, DC: 2017, pg.93.
Available under CC BY 3.0 IGO.
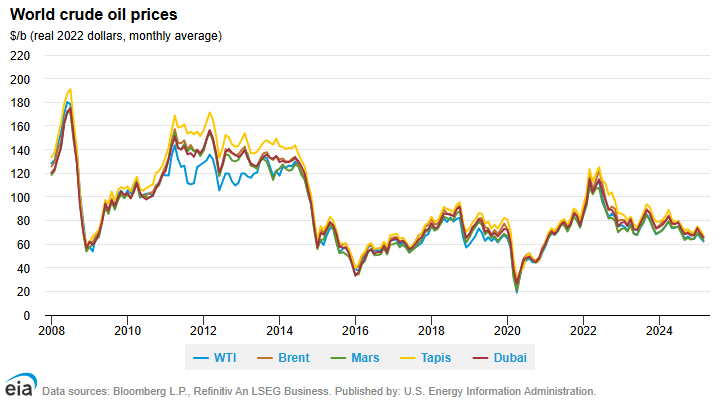
Table 3 shows how oil prices have fallen since 2014 and are now at a similar level to those of 2004. In real terms – after allowing for inflation – they are about 27 percent lower.

Largely as a result of the fall of oil prices, the oil export revenues of Middle East OPEC members have changed dramatically. In 2005 they came to $411 billion. By 2012 they peaked at $900 billion, but by 2016 they had fallen to $357 billion.
While the interests of Middle East members of OPEC are different, a production cut suited all of them. Iran is keen to increase oil export revenues to finance reconstruction after years of damage due to sanctions. Iraq would also like to increase sales to finance reconstruction after years of conflict. They are both restrained by the limits on the oil production capacity and so have agreed to the imposition of OPEC quotas. Saudi Arabia the other producers in the Gulf want stability. They want to avoid oil prices, and thus revenues, falling but they also fear that rising prices will accelerate the move away from oil that is now underway.
Oil prices are not expected to increase significantly in the medium term. The reasons are given in the International Energy Agency’s (IEA) ‘World Energy Outlook 2017’ that was published in November. The forecasts made in this report help to explain why OPEC and other countries are trying to hold down production.
The IEA identified several large-scale changes that are taking place in global energy market. These are the rapidly increased use of and falling costs of clean energy technologies; the growing electrification of energy; the shift to a more services-oriented economy and a cleaner energy mix in China, and the resilience of shale gas and oil in the United States. The IEA also noted that the fastest growth of energy consumption in the coming years will be in India, 27 percent faster than in China.
Clean energy or renewables will account for two-thirds of global investment in power plants in the period to 2040 as they become the cheapest source of new generation for many countries. Rapid deployment of solar photovoltaics (PV), led by China and India, will help solar energy become the largest source of low-carbon capacity by 2040, by which time the share of all renewable sources in total power generation will reach 40%. According to Morgan Stanley, as a result of “years of heavy investment in new and more efficient technology and manufacturing capacities at greater scale and less cost, wind and solar power are winning over perhaps the most significant constituent in the global energy market: the large-scale utilities that generate, store and distribute power across vast energy grids to industrial, business and residential consumers. Globally, the rise of renewables is set have a dramatic effect on utilities.”[2] In the seven years to 2016, the cost of wind power fell from $60-$100 per megawatt-hour (MWh) to around $15-$25/MWh in the middle third of the U.S., and for large solar installations, costs fell from $100-$300 to $40-$70 per MWh. Wind power is currently the cheapest source of energy in the Mid-West, with a cost of $15-$25/MWh, comparing with the $55-$65/MWh for new natural-gas-fired plants.[3]
In the European Union, renewables now account for 80% of new capacity and wind power will become the main source of electricity generation from 2030. Policies continue to support renewables in electricity worldwide, and the transformation of the power sector is being accelerated by millions of households, communities and businesses investing directly in solar PV.
According to the Financial Times,[4] in 2016, global power generation capacity using renewable rose by 9 per cent— a fourfold increase since 2000. This was buoyed by the growth of newer sources such as solar power that rose by more than 30 per cent. For the second year in a row, renewable energy accounted for more than half the new power generation capacity added worldwide. Sales of plug-in electric vehicles in 2016 were 42 per cent higher than in 2015, growing eight times faster than the overall vehicle market. The storage capacity of big lithium ion battery systems more than doubled in 2016.
Growth in renewables is not confined to the electricity generation sector. The direct use of renewables to provide heat and mobility worldwide is also forecast to double, albeit from a low base. Worldwide, the share of direct and indirect renewables in final energy consumption is forecast to increase from 9 per cent today to 16 per cent in 2040. Industrial electric motor systems account for one-third of the increase in the demand for power. Rising incomes mean that millions of households will use electrical appliances (especially smart connected devices) and install air conditioning systems.
Electricity is playing an increasing role in heating and transport. Industry initiatives and government encouragement results in the projection for the global electric car fleet of 280 million by 2040, compared with two million in 2017. The scale of future electricity demand and the challenge of reducing carbon release meant that in 2016, for the first time, global investment in electricity generation exceeded that in oil and gas.
The IEA also made forecasts about the oil market. Until the mid-2020s, demand growth remains strong but then slows as greater efficiency and fuel switching bring down oil use for passenger vehicles. Consumption in other sectors is enough to keep oil demand on rising from about 98 mb/d in 2017 to 105 mb/d by 2040. Oil used to produce petrochemicals is the largest source of growth, closely followed by rising consumption for trucks, aviation and shipping.
Once US oil production ceases in rise in the late 2020s and non-OPEC production declines, the market will become increasingly reliant on the Middle East. There is a continued large-scale need for investment to develop a total of 670 billion barrels of new resources to 2040, mainly to make up for declines from existing fields rather than to meet the increase in demand.
The United States is forecast to account for 80% of the increase in global oil supply to 2025 and this will maintain downward pressure on prices. Remarkable technological progress has enabled the United States, and to a lesser extent some other counties, to unlock new energy resources.
According to IEA projections, the 8 million barrel a day (mb/d rise) in US oil output from 2010 to 2025 would be equal to the highest sustained period of oil output growth by a single country in the history of oil markets. A 630 billion cubic meter (bcm) increase in US shale gas production over the 15 years from about 59 billion cubic meters in 2008 is also dramatic.
By the mid-2020s, the United States will become the world’s largest liquefied natural gas (LNG) exporter and a few years later a net exporter of oil – still a major importer of heavier crudes that suit the configuration of its refineries, but a larger exporter of light crude and refined products.
As a result of the fall in the cost of renewables, investment in oil and gas is being affected. The reduction of investment in oil and gas means that capacity will grow slowly due to cost cutting measures in maintenance of existing fields. The World Bank has recently announced that it will stop financing oil and gas exploration.
The IEA’s central forecast assumes demand rise from 92.5 mb/d in 2015 to 103.5 mb/d by 2040. India will be the leading source of demand growth and China will overtake the United States to become the single largest oil-consuming nation.
Forecasts of oil demand made by the IEA, oil companies and others have been questioned on the grounds that they do not sufficiently allow for changes that are already in place. Changes in technology and policy could slow the growth of demand, or even eliminate it altogether in some parts of the economy. About 60 percent of oil is used in transportation, which is where the largest technological changes are emerging. Advances in vehicle efficiency, the increase in the number of electric cars, tighter emissions standards and shifts to other fuel sources would result in lower demand for oil.
Governments are increasingly concerned about climate change and air pollution, and are pushing tighter fuel-efficiency standards, or creating low-emission zones for cars and even ships.
The UK, France, the Netherlands and Norway have all announced that petrol and diesel cars will be phased out by 2040. Possibly the most significant change in transport technology will be the electric car. A move away from individual ownership of petroleum-powered vehicles toward the sharing of high-tech, possibly driverless cars would have far-reaching economic and social consequences, particularly because their development is being pushed hardest in the fastest-growing major economies. China’s latest plans suggest that new vehicle growth will be electric while India plans to sell only electric cars by the end of the next decade. According to the IEA, widespread switching to alternative fuels including natural gas and biofuels could displace about 13.5 mb/d of oil demand by 2040. That would be more than double the gain from electric cars.
If global warming to is limited to two degrees Celsius as determined in the Paris Climate Accord, oil demand would peak around 2020 and declining by about 20 mb/d by 2040. That is over 30 mb/d lower than the average forecast for 2040 made by major oil companies and the IEA.[5] The stakes are high and OPEC understands the consequences for oil demand, even though its own forecasts suggest otherwise.
[1] For a previous discussion on this topic see Paul Rivlin, Middle East Uncertainty and Oil Price Stability, Iqtisadi, June 2015.
[2] Morgan Stanley, "Renewable Energy Hits Global Tipping Point," Ideas, July 27, 2017.
[3] Morgan Stanley, "Why Clean Energy Can Withstand Changing Political Winds," Ideas, November 11, 2016.
[4] Pilita Clark, “The Big Green Bang: how renewable energy became unstoppable,” Financial Times, May 18, 2017.
[5] Jessica Shankleman and Hayley Warren, "This is What the Demise of Oil Looks Like," Bloomberg, July 26, 3017.